Protein Food Chart In Grams: Compare Everyday Portions
Joey Habib · · 10 min read
- protein
- meal planning
- macro tracking
- grocery budgeting
- nutrition
A protein food chart in grams shows the approximate protein in everyday portions, so you can compare foods using the amount you might actually eat. Use it to choose a meal’s protein source, estimate a meal’s contribution to your macro plan and shortlist grocery options; then match the food’s raw, cooked, dry or drained state to the label or database entry before logging it.
For Australian Coles shoppers planning meals against a grocery budget, the decision is not simply which food has the most protein per 100 grams. It is which practical portion fits the meal and the budget, including the cost of any pack remainder. The chart is a starting point, not a personal protein prescription or a guarantee of what a particular brand contains.
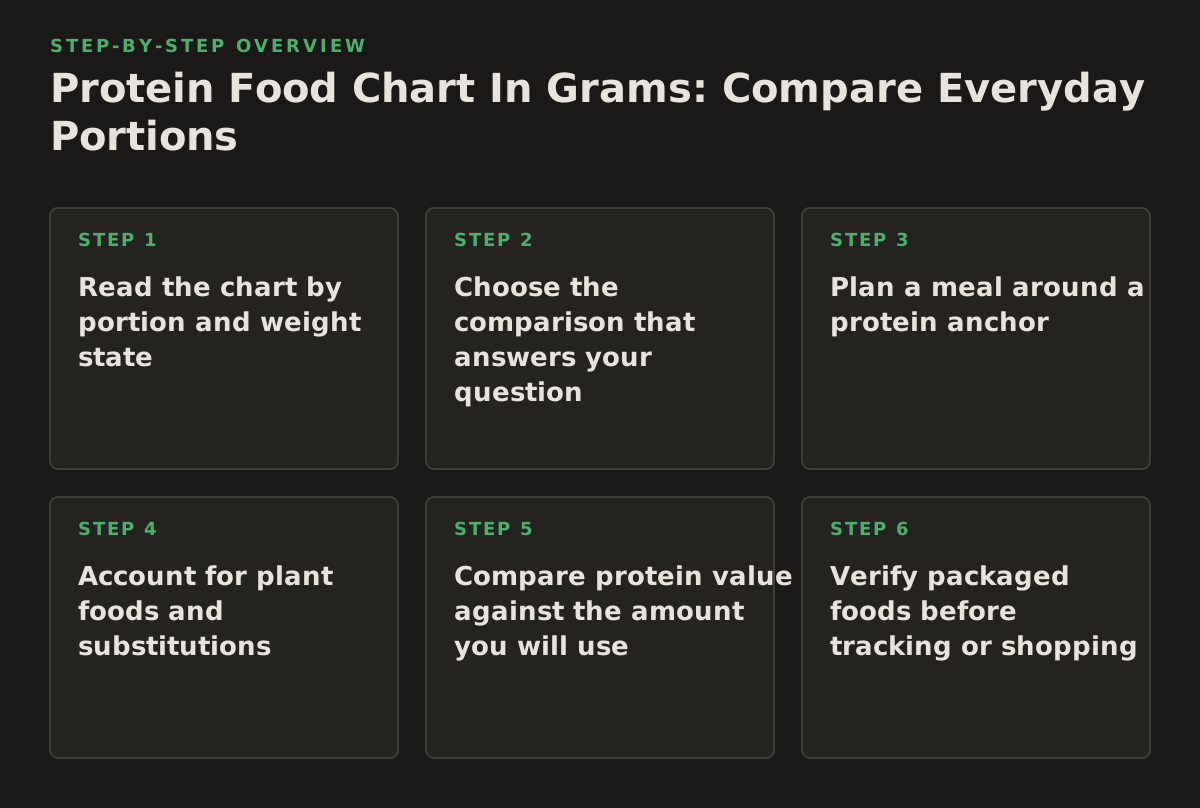
1. Read the chart by portion and weight state
Protein figures are only comparable when the foods are described on a compatible basis. Cooking changes water content and weight, so cooked meat can have a different protein concentration per 100 grams than raw meat. Drained tinned fish and cooked legumes also need entries that match their state. Use the same state you weighed: raw for ingredients weighed before cooking, cooked for portions weighed on the plate, and drained for food weighed after draining.
The estimates below are rounded examples for common portions, not product specifications. Food varieties, preparation and brands vary. The Australian Australian Food Composition Database and the USDA’s FoodData Central provide composition data; select the closest food description and preparation rather than assuming every entry with a similar name is interchangeable.
| Food and state | Example portion | Approx. protein | Planning use |
|---|---|---|---|
| Chicken breast, cooked | 100 g | 31 g | Main meal anchor |
| Lean beef, cooked | 100 g | 26 g | Main meal or mince dish |
| Tuna, canned in water, drained | 100 g | 25 g | Quick lunch ingredient |
| Salmon, cooked | 100 g | 22 g | Fish main |
| Firm tofu | 150 g | About 22 g | Plant-based main |
| Eggs, cooked, edible portion | About 2 eggs (100 g) | About 13 g | Breakfast or add-on |
| Plain Greek-style yoghurt | 170 g | About 16 g | Breakfast or snack |
| Cottage cheese | 150 g | About 17 g | Snack or meal component |
| Edamame, cooked | 150 g | About 18 g | Side or bowl ingredient |
| Lentils, cooked and drained | 200 g | About 18 g | Soup, curry or salad |
| Chickpeas, cooked and drained | 200 g | About 18 g | Bowl, salad or stew |
| Milk | 250 mL | About 8 g | Drink or recipe ingredient |
| Peanut butter | 30 g | About 8 g | Addition, not a main anchor |
| Rolled oats, dry | 50 g | About 7 g | Breakfast base |
Keep weight states visible in your notes
A common tracking error is weighing 100 g of raw chicken and selecting a cooked-chicken entry. The amount logged may then be inaccurate because the two entries describe different states. For meal prep, record the state next to the weight—for example, “150 g lentils, cooked and drained”—so the same entry can be selected next time. If a recipe database requires raw ingredient weights, use the raw weight and a matching raw entry instead.
2. Choose the comparison that answers your question
Per-100-gram figures help compare how concentrated foods are, while a portion figure answers how much a serving contributes. Neither measure alone identifies the best choice. A smaller portion of a concentrated food and a larger portion of a less concentrated food may contribute similar protein but differ in recipe fit, price and the rest of their nutrition.
Use a like-for-like comparison
- For a meal: compare the protein in the quantity you plan to eat.
- For shopping: compare the same basis, such as drained tuna with drained tuna, or two yoghurt products per 100 g.
- For recipe tracking: note whether ingredients were weighed raw, cooked or drained, then use a matching entry.
For example, if a meal plan calls for 100 g of cooked chicken, use the cooked estimate for the portion. If you weigh the chicken raw to calculate a batch recipe, use a raw entry and keep the recipe’s weights consistent. Consistency is more useful than false precision: a rounded value applied to the right food state is a better estimate than several decimal places from a mismatched entry.
The failure mode is comparing foods on different bases and treating the result as a real difference in the food. If one product is listed per drained weight and another per contents including liquid, first find comparable entries or calculate from the amount actually eaten. If that is not possible, label the comparison as an estimate rather than ranking it as exact.
3. Plan a meal around a protein anchor
This approach is useful when assembling meals from a macro target, meal-prepping several portions or deciding what to buy for the week. Start with the main protein source, then add the vegetables, grains and other ingredients that suit the dish. A chart serving is not a universal meal target; daily protein needs vary between people. Australia’s Nutrient Reference Values for protein provide reference values by population group, so use an appropriate personal or professional plan rather than treating one chart row as a prescription.
Calculate the meal contribution, not just the anchor
- Choose a protein source and define the portion you will actually serve.
- Estimate its protein using a matching label or food-composition entry.
- Add meaningful contributions from other ingredients, such as milk in porridge or legumes in a stew.
- Compare the meal total with your own plan; do not assume one ingredient has to provide the entire day’s protein.
Illustrative example: a bowl containing 100 g cooked chicken contributes roughly 31 g of protein from the chicken before counting the rest of the bowl. A tofu bowl could use a larger tofu portion to reach a similar contribution, subject to the product’s label. The practical comparison is whether each version fits the meal, your intended portions and your plan—not which row has the largest number.
A failure mode is choosing an anchor based only on protein and then discovering that the portion does not work in the recipe or leaves too little room for the other foods in the meal. Before scaling a portion, check how it affects the whole dish and your other macro targets. For a household meal, calculate the batch total and divide by the portions actually served rather than assuming every person receives the same amount.
4. Account for plant foods and substitutions
Plant-based foods can contribute protein, but a useful comparison needs realistic portions. Cooked lentils and chickpeas, for example, are usually eaten in larger portions than a 100 g meat or fish serving, and they also contribute carbohydrates and fibre. USDA’s Protein Foods guidance includes beans, peas, lentils, nuts, seeds and soy products as well as eggs, seafood and meat. Use the foods that suit your diet; there is no need to make every meal follow a special pairing rule.
Compare the portion and the full macro effect when substituting one anchor for another. If replacing chicken with tofu, use the tofu’s actual product information to estimate the portion needed, then check how the swap changes the rest of the meal. Equal weights of different foods do not necessarily supply equal protein, and a portion large enough to match protein may not suit every recipe.
For legumes, avoid logging a dry weight using a cooked entry, or vice versa. Record the cooked and drained serving when that is what you eat, or use a dry entry for the dry recipe ingredient. For a planned lunch, for instance, you might portion cooked lentils as the base and add another suitable protein ingredient only if the planned serving needs it. Build the meal around the amount you will eat, not a theoretical 100 g comparison.
A failure mode is making a substitution on protein alone and overlooking cost, texture, portion size or other macros. Change one main ingredient at a time in the recipe plan, then compare the new portion’s protein and cost with the original. This makes it easier to see whether the replacement is workable without claiming that the foods are nutritionally identical.
5. Compare protein value against the amount you will use
Protein per portion helps with meal design; protein per dollar can help with grocery choices. To estimate it, divide the cost of the amount used by the protein grams in that same amount. For a packaged item, distinguish the cost of the portion from the amount paid for the whole pack. Whole-pack cost matters when the remainder is not assigned to another meal.
| Decision check | What to compare | Example action |
|---|---|---|
| Meal fit | Food, portion and recipe role | Set the amount needed for the planned dish |
| Protein contribution | Protein in that amount | Use the matching label or database entry |
| Cost of use | Price for the quantity used | Calculate the portion cost from pack price and quantity |
| Pack remainder | Amount left after the recipe | Assign it to another planned meal or account for waste risk |
| Substitution impact | New portion, macros and cost | Compare both versions using the same criteria |
For an illustrative comparison, suppose two products can both work in a planned meal. First calculate the protein in the amount each recipe would use. Then divide the cost of that amount by its protein grams. If the lower-cost option requires buying a larger pack, note whether another planned meal will use the remainder. This is a decision method, not a claim about current Coles prices; check the pack size and shelf price when shopping.
The failure mode is calling a product a bargain because its cost per protein gram is low while ignoring an expensive pack remainder or a portion too large for the dish. Keep three figures separate: pack price, cost of the amount used and leftover amount. That makes it clear whether the apparent saving depends on using the rest of the pack.
6. Verify packaged foods before tracking or shopping
Generic chart estimates are useful for early planning, but packaged foods can differ by brand and formulation. For a product you regularly buy, compare the protein per 100 g on its nutrition information panel, then calculate your usual portion from that figure. A stated serving size may not match the amount you eat. FSANZ explains how to interpret an Australian Nutrition Information Panel; use the product’s own panel for its specific declared values.
For an unlabelled ingredient, select a database entry that matches the food, preparation and state as closely as possible. “Greek-style yoghurt” is not automatically interchangeable with plain yoghurt, and raw meat is not interchangeable with cooked meat. Match the description before refining the number. If the database has several plausible entries, record which one you chose and use it consistently for that food until the product or preparation changes.
A failure mode is switching entries repeatedly because one gives a more convenient result, without changing the food itself. That makes weekly comparisons hard to interpret. For packaged products, use the label when available; for recipe ingredients, use a consistent matching database entry. If the package or recipe changes, update the record and note the reason.
For Coles shoppers who want to connect macro targets with planned meals and grocery costs, Macronomics is designed to estimate meal and whole-pack grocery costs and compare protein costs across products. Its beta onboarding is staged, so check the site for current availability rather than assuming access.
Implementation plan: use the chart for your next shop
- Set the target you already follow. Use an appropriate plan or reference value; do not turn an example chart portion into a personal prescription.
- Choose meals before products. Pick a protein anchor for each meal and write down whether its weight will be raw, cooked, dry or drained.
- Estimate portions consistently. Use the chart as a first pass, then check the label or a closely matched database entry for foods you buy regularly.
- Compare realistic alternatives. Assess meal fit, protein in the amount used and the cost of that amount, rather than relying on protein per 100 g alone.
- Plan for whole packs. Assign leftovers to another meal or include the unused amount in your cost decision.
- Update after shopping. If the product, pack size or price differs from the plan, revise the estimate and keep the same weighing method in your food log.
If you want a planning tool that brings macro targets together with meal and whole-pack grocery cost estimates, visit Macronomics. Check Macronomics for current beta onboarding details before relying on it for a particular shop.
Authored with NotFair SEO